- Report Summary
- Table of Content
- Methodology
- Request for ESG Consultation
Report Overview
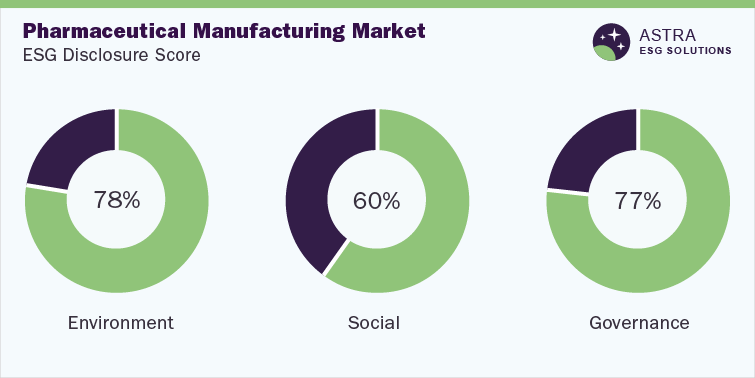
The average ESG disclosure score for the pharmaceutical manufacturing market is between 70% and 80%. This disclosure score has been derived from a detailed analysis of ESG parameters within our robust ESG scoring framework. In our research, we assessed Merck & Co., Sanofi SA, and six other global market leaders.
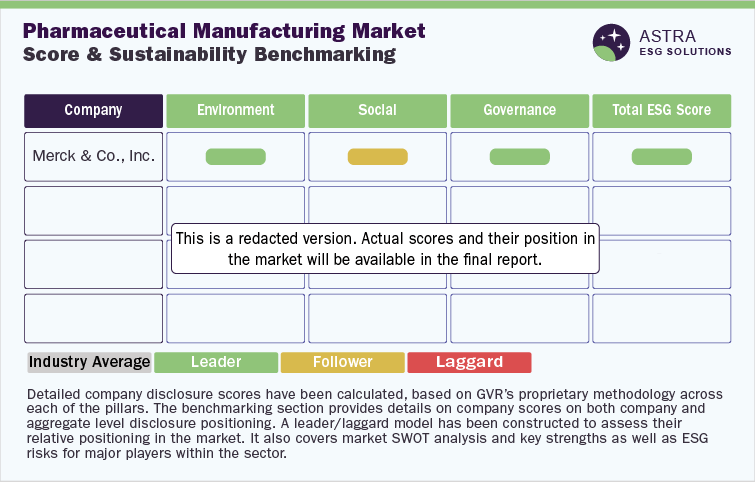
As per the research, only four companies, including Merck & Co and Sanofi SA, have scored above average industry scores. The two other companies are following norms of ESG reporting and disclosure but score below the industry average. Furthermore, our research concluded that more than half of the ESG disclosures have been made regarding the governance and environment indicators, followed by social indicators, with Merck & Co. leading the sector.
Environmental Insights
The pharmaceutical sector is the backbone of the medical industry. Pharmaceutical products and operations can have a detrimental impact on the environment throughout the different stages of their lifecycle, especially in the production phase. Mistreatment or mishandling of pharmaceutical chemicals and waste can lead to water contamination, thereby causing a significant negative impact on the environment.
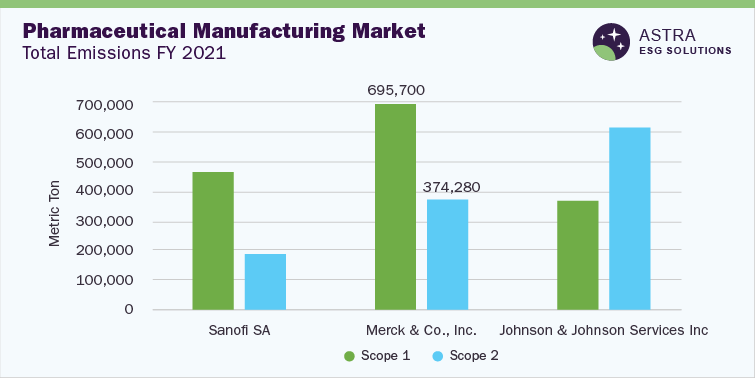
Sanofi SA, Merck & Co., and Johnson & Johnson Services have the highest disclosure score on the environmental pillar. In our research, it was observed that Johnson & Johnson reported the highest scope 2 emissions for the reporting year 2021 and Merck recorded the highest scope 1 emissions. In terms of energy consumption, Merck & Co. reported the highest value, while Johnson & Johnson had the lowest energy consumption. Johnson & Johnson also had the lowest scope 1 emissions among the top three firms. Johnson & Johnson has been able to reduce its energy consumption and emissions owing to the implementation of active energy-reducing techniques, including optimization of renewable energy. Sanofi is making significant efforts toward carbon neutrality and, hence, has reported the lowest emission intensity among the top three firms in 2021.
Among the top three companies, only all of Sanofi’s sites have been ISO 14001 certified, while only some sites of Johnson & Johnson and Merck have ISO 14001 accreditation. However, the three companies have water management systems to ensure responsible consumption and disposal. Even though Merck and Sanofi are working toward effective waste handling & disposal, Johnson & Johnson has not disclosed any waste-related initiatives or programs.
Social Insights
Various aspects of the social pillar have been explored while analyzing the top eight companies in the pharmaceutical manufacturing market, including turnover rate, training hours, and safety certification. As per our holistic analysis, the top three companies based on social disclosure are Novartis AG, Merck & Co., and Sanofi SA.
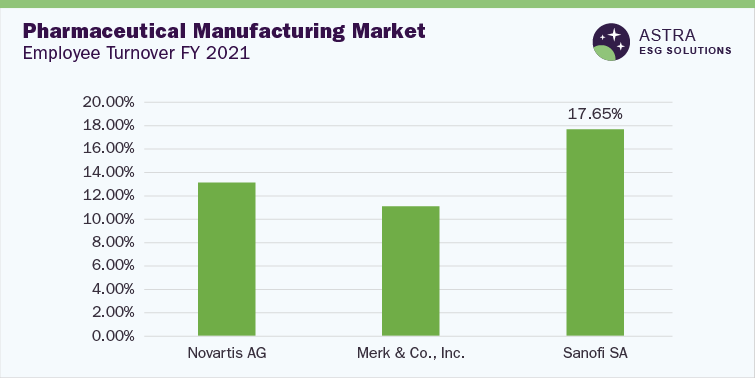
As per our analysis, Sanofi reported the highest turnover rate, while Merck had the lowest turnover rate. Merck’s low turnover rate is indicative of positive workforce satisfaction. As per our observations, Merck had the highest number of training hours for its employees, while Sanofi SA had the lowest number of training hours. Although the top three companies have provided employee data and training hours, there is no disclosure regarding customer satisfaction.
Health and safety are among the most important aspects of pharmaceutical manufacturing units, especially because the workers are handling hazardous chemicals. Among the top three companies, most of the sites of Novartis and Sanofi are ISO 45001 certified; however, Merck & Co. has not disclosed any information regarding health & safety certifications.
Governance Insights
Merck & Co., Sanofi SA, and AbbVie, Inc. are the top three pharmaceutical companies in terms of governance disclosure. The top company, Merck & Co., has a score of more than 90% in governance disclosure.
As per our research, in FY 2021, Sanofi SA reported the highest percentage of females on the board of directors, while AbbVie had the lowest. Sanofi’s high female percentage highlights the importance of diversity in the company. AbbVie, Inc. had the highest percentage of independent directors, while Sanofi had the lowest percentage of independent directors. A higher percentage of independent directors indicates AbbVie’s strong governance structure.
Country-level Insights
In 2021, Germany was the top nation exporting pharmaceutical products, accounting for 15% of the global pharmaceutical revenue. It is one of the oldest pharmaceutical markets, which has continued to achieve stability with a large demand for pharmaceutical exports. The country is home to around 500 pharmaceutical companies that are mostly Small to Medium-sized Enterprises (SMEs).
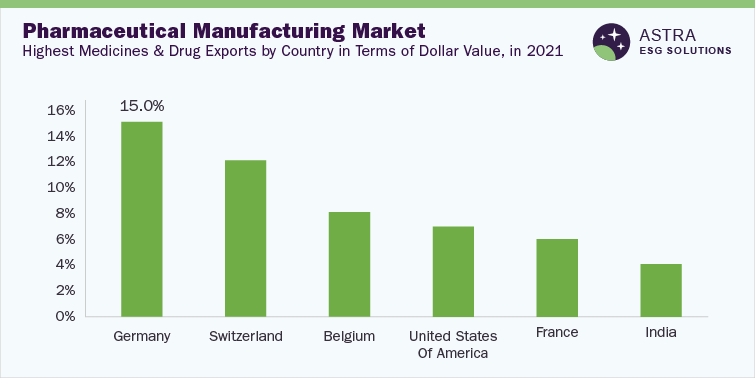
Switzerland was only second to Germany, accounting for 12% of the total sales. The robustness of the pharmaceutical sector in the country can be attributed to its strong political landscape, which provides legal support for introducing new & enhanced medicines. The other top countries were Belgium, the U.S., France, and India. As of 2022, India has been the largest provider of generic drugs, with 500 API producers presently operating in the country.
Market Overview
The pharmaceutical manufacturing market was worth USD 516.48 billion in 2022 and is expected to grow at a CAGR of 7.63% from 2023 to 2030, according to Grand View Research. Citing sources, World’s Top Exports noted that global sales from worldwide export of medicine and drugs stood at USD 426.8 billion in 2021. The highest dollar value of medicine exports was in Europe, which accounted for around USD 337 billion (~79%) of global revenue. Moreover, Asia was responsible for around 10% of the global pharmaceutical exports, whereas North America was responsible for around 9% of the exports.
Investments made in pharmaceuticals also increased due to the pandemic. In 2020, Switzerland-based Novartis raised USD 2.21 billion through sustainability-linked bonds to fulfill the social target of making medicines accessible to the poorer sections of society. Furthermore, in 2022, the company invested USD 1.04 million in the biologics center at its campus in Basel for biological drug development to treat cancer and other autoimmune diseases. Such innovations, investments, and inventions are making the pharmaceutical sector more accessible to everyone in society. This revolution is aiding the movement toward reducing barriers in medicine.
Chapter 1. Introduction of Sustainability in Pharmaceutical Manufacturing
1.1 A Perspective on the Top Countries in the Global Pharmaceutical Manufacturing Market
1.2 Legislations Across Top Countries in Pharmaceutical Manufacturing
1.3 Investments Including Sustainable Investments in the Pharmaceutical Manufacturing Sector Across the Top Countries
1.4 Pharmaceutical Manufacturing and its Impact on ESG
1.5 Patents
1.6 Mergers, Deals & Acquisitions
Chapter 2. Industry Benchmarking
2.1 Overall Industry Disclosure Score
2.2 Disclosure Score Benchmarking
2.3 SWOT Analysis and ESG Benchmarking
Chapter 3. Company Profiles
3.1 Merck & Co., Inc.
3.2 Sanofi SA
3.3 Novartis AG
3.4 AbbVie, Inc.
3.5 Johnson and Johnson Services, Inc.
3.6 GlaxoSmithKline Plc
3.7 Pfizer, Inc.
3.8 Sun Pharmaceutical Industries Ltd.
Research methodology
Grand View Research (GVR) employs a holistic and robust research methodology focused on delivering precision. Our ESG key issues are selected following a thorough materiality analysis run by our taxonomy committee. We examine leading business journals relevant to the industry sector and where applicable references are made to a range of sources including regulatory agencies, trade associations, company filings, white papers, and analyst reports during the due diligence on data aggregation. In addition, a recurring theme that remains central to all our research reports remains data triangulation which aims to dive into the market from thematic context, regulation, and industry benchmarking, including SWOT analysis.
Eligibility Criteria and Company Selection
Each public company is curated by our senior researchers following a comprehensive study of their business involvement around a specific theme. The involvement extends to subsidiaries based on at least 50% holding by the parent company. Following this, we analyze fundamental financial indicators, including revenue and market capitalization to ensure a diverse set of companies that fairly represent the sector are included. Additionally, GVR researchers ensure the disclosure level of each company across the material ESG key issues.
Scoring Methodology
Each ESG metric is assigned a specific weight based on its relevance across sectors. Below are the aggregated weights across pillars, which are derived from each metric.
| Environment | Social | Governance |
| 40% | 30% | 30% |
GVR’s proprietary ESG score is calculated using a weighted average method at:
• Key issues level
• Pillar level
• Company level and,
• Theme level
Data Mining
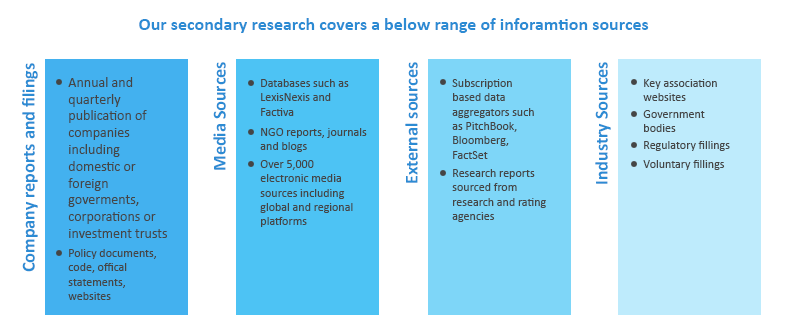
Data is obtained and collated from diverse source points. The data collected is continuously cleansed to ensure that only validated and verifiable sources are analyzed. In addition, data is also mined from a large number of in-house syndicated research reports inventory as well as through paid databases and premium content. During this research report, we conducted multiple primary interviews across the globe supported by our Primary Research Panels through the delivery of a mix of paid and unpaid interviews. We also send and receive responses from a wide section of industry participants through a carefully crafted and comprehensive survey questionnaire. We triangulate these data into quant models and generate qualitative insights. Evolving industry dynamics that shape drivers, restraints, and pricing are also gathered. As a result, the published content includes proprietary data and meaningful insights.
Fundamental ESG data:
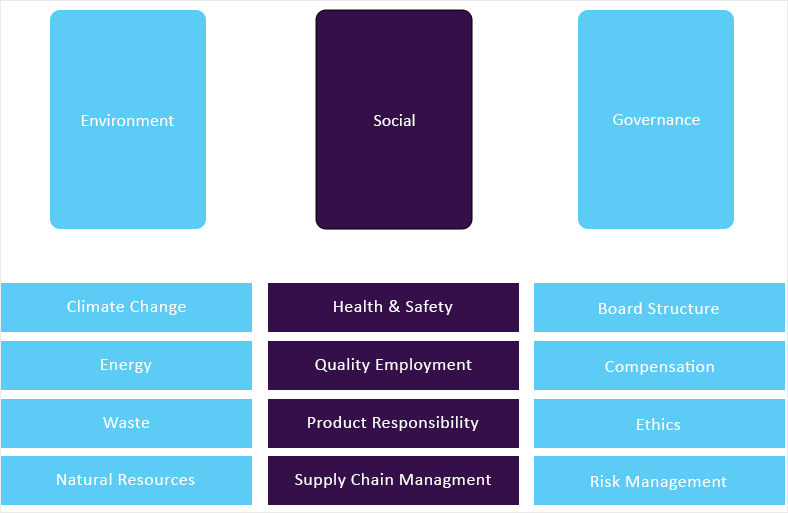
GVR’s ESG taxonomy committee maintains the framework and ensures it is updated quarterly considering market updates and relevance. Framework includes 65+ fundamental ESG metrics that are identified following a thorough materiality assessment. Below is GVR’s ESG Level-I framework:
Alternative ESG data:
GVR also analyzes macro-economic factors that impact or drive the growth of respective sectors. This includes
• Deep dive analysis of policy and regulatory landscape that has potential towards shaping the future of businesses
• Innovation quotient of a sector to gauge prospective evolution of a theme and related opportunities
• Investment scenario, including mergers & acquisition, funding and other deals to assess the investment appetite for a particular theme
• Other market activities, including market size, growth forecasts among others.
Information sources
