- Report Summary
- Table of Content
- Methodology
- Request for ESG Consultation
Report Overview
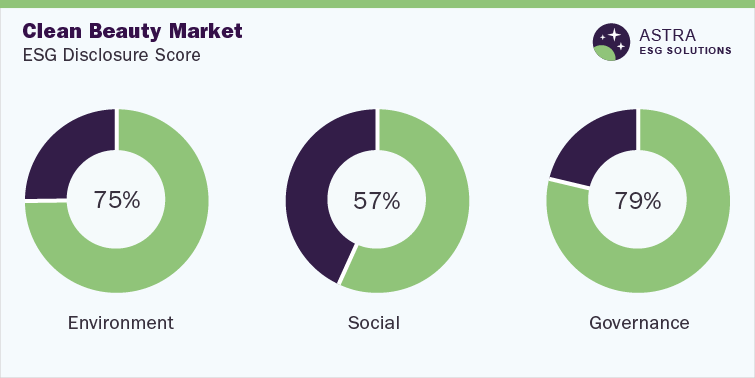
The average ESG disclosure score for the clean beauty market stands between 60% and 80%. This conclusion has been derived from a detailed analysis of ESG parameters within our robust ESG scoring framework. Through our research, we assessed Kao Corporation, Unilever PLC, and eight other global industry leaders.
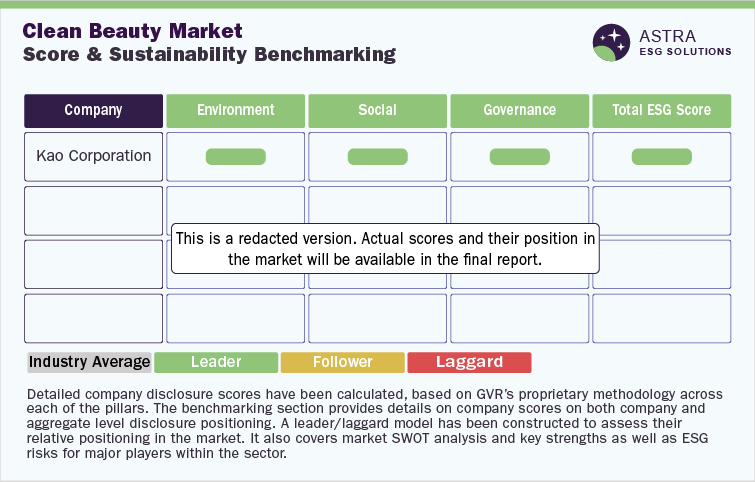
According to our research, only three companies, including Kao Corporation and Unilever PLC, had above-average industry scores. Even though seven other companies are following ESG reporting and disclosure norms, these firms scored below the ‘leader’ disclosure range according to our research. Furthermore, the research concluded that over half of the ESG disclosures have been made around the governance and environment indicators, with Kao Corporation leading the course in the sector.
Environmental Insights
The beauty industry has evolved to include various processed and packaged materials detrimental to the environment. Packaging of beauty products, including materials such as plastic, paper, glass, and metal, ends up in landfills. Plastic waste produced by the clean beauty market contributes to photodegradation, which breaks plastic into microscopic sizes. Due to this microplastic, millions of aquatic animals die. Furthermore, palm oil production results in deforestation and habitat loss.
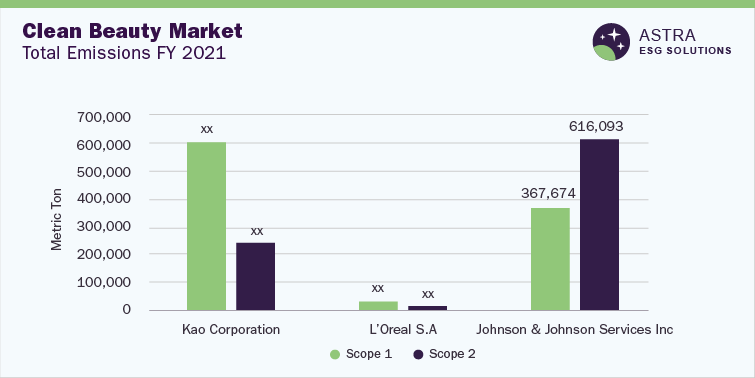
Kao Corporation, L’Oréal S.A., and Johnson & Johnson Services Inc. scored the highest disclosure score in the environmental pillar. According to our research, Kao Corporation reported the highest scope 1 emissions in 2021, while L’Oréal reported the lowest. Among the top three companies, Johnson & Johnson Services Inc. reported the highest scope 2 emissions, while L’Oréal reported the lowest. As per the energy consumption analysis, Kao Corporation reported the highest energy consumption and energy intensity for 2021, whereas L’Oréal reported the lowest.
Over 85% of the facilities owned and operated by these top three companies are accredited with ISO 14001. Besides, water management programs are a priority for all the top three companies. To minimize water consumption, Kao Corporation utilizes the 3R principle – reduce, reuse, and recycle. Moreover, L’Oréal Group is committed to preserving water resources through deploying tools to monitor consumption and identify potential reductions. Waste reduction is an important goal for the cosmetics industry, as packaging materials cause harm to the environment. Hence, to minimize the use of packaging materials, Kao Corporation adopted a 4R strategy – recycle, reuse, reduce, and replace. L’Oréal continuously works toward reducing outdated inventory to assist packaging teams and follows ecodesign principles.
Social Insights
Formulations used in the beauty industry have been under the radar for various reasons, including the use of artificial pigments, parabens, phthalates, & lead, which may be carcinogenic and have harmful effects on the skin & the reproductive system. These formulations must be curated with attention to the short-term and long-term health outcomes of skincare product usage. As manufacturing skincare products involves handling chemicals and substances, proper health & safety precautions and fair labor practices need to be followed. Our analysis of the social pillar dives deep into various facets of the disclosures by the top 10 companies.
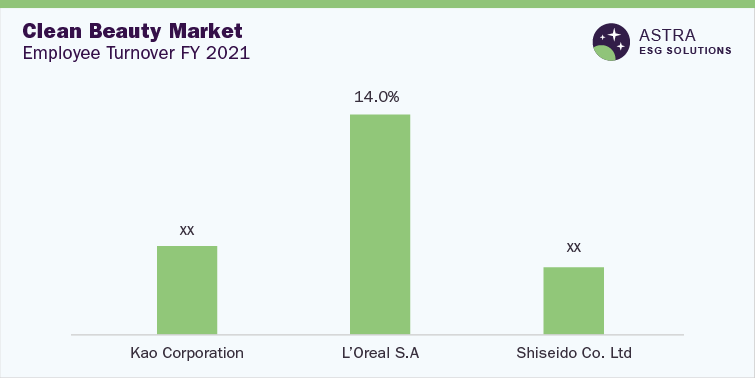
Among the top three companies, Kao Corporation had the lowest turnover rate compared to L’Oréal in 2021. The low turnover rate by Kao Corporation signifies effective human capital management and practice. Shiseido Co. Ltd. reported the highest training hours for FY 2021, while Kao Corporation had the lowest.
As per our research, certain sites of the top three companies are certified with ISO 45001 (Occupational Health and Safety Certification). However, all three companies have adopted a human rights policy and supplier code of conduct, including adherence to human rights.
Governance Insights
Unilever PLC, Shiseido Co. Ltd., and The Estee Lauder Companies Inc. are the top three companies in the governance pillar.
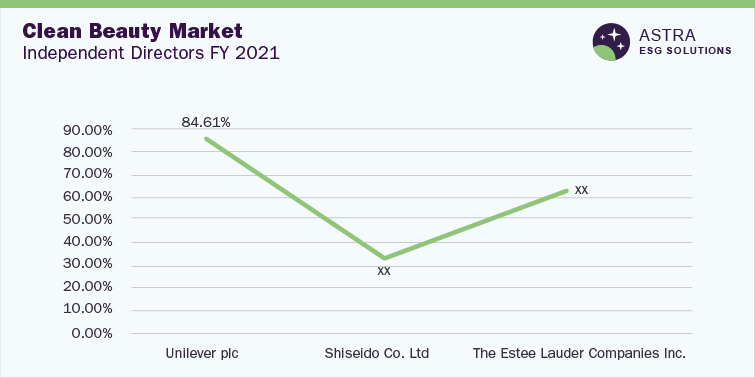
Unilever PLC reported the highest percentage of women on its board, while Shiseido Co. Ltd. reported the lowest. Unilever PLC also reported the highest number of independent directors on board, while Shiseido Co. Ltd. had the lowest. A higher percentage of independent directors helps its governance structure be more transparent and improves the company’s credibility.
Among the top three companies, Unilever PLC and Shiseido have established important measures to mitigate cybersecurity risks and implement information security management systems. Unilever deploys personnel training for security risk management and has separate contingency systems in place to back up the hardware of the core operating systems. Likewise, Shiseido has established information security management systems, with the chief information security officer overseeing risks related to cybersecurity. However, Estee Lauder Companies Inc. has not disclosed any programs related to cybersecurity. The top three companies have externally disclosed their code of conduct applicable to all employees, officers, and global subsidiaries.
Country-level Insights
In 2021, France, South Korea, Singapore, Japan, and the U.S. had the most exports compared to any other country worldwide. France accounted for 15% of the total exports, followed by South Korea and Singapore.
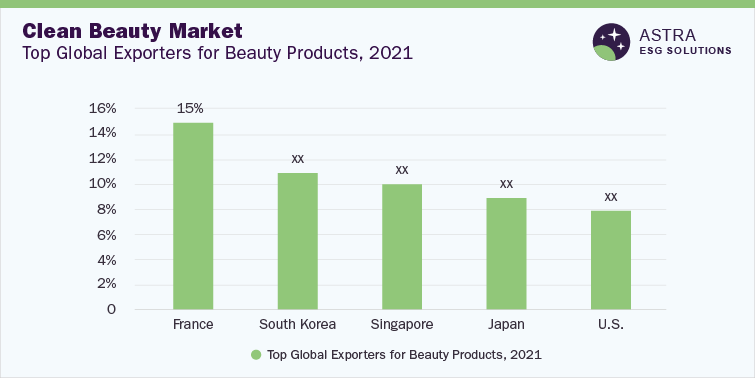
France has the highest exports and global share in beauty, personal care, & skincare products. It has some of the leading organic and natural product brands, such as Bloomea Paris, DYP Synthetic, and Geodara Parfums. These brands offer professional and natural personal care through eco-friendly products. South Korea is only second to France, popular for its K-beauty market, which grew due to the prominence of Korean pop culture. However, South Korea’s share in the export of beauty, skincare and cosmetic products witnessed a drop due to the demand for eco-friendly products. As a result, with time, Korean skincare brands have experimented with their formulations with natural ingredients and adopted sustainable packaging.
Singapore and Japan are the other countries in Asia leading the global exports. The middle-class population in Asia is a strong target for these products, as the population has a significant focus on holistic well-being and top-quality products. For Japan, its cultural heritage and exquisite ceremonies have helped the country maintain its image as an authentic and sustainable country for cosmetic products. On the other hand, the U.S. held the largest share in organic and natural products in 2021. The U.S. is likely to retain the dominance as demand for organic face creams and make-up products continues to surge.
Market Overview
The global clean beauty market was worth USD 6.5 billion in 2021 and is expected to reach USD 15.3 billion in value by 2028. The highest dollar value of cosmetics was in France, which accounted for around USD 11 billion of the global revenue. South Korea, Japan, and Singapore accounted for around 30% of the global cosmetic exports, whereas the U.S. accounted for around 8%.
Investors in the beauty industry have been promoting sustainability and biopackaging. In 2021, a clean beauty manufacturer in France, SHIGETA Corporation, made a capital alliance with an investing firm in Japan, Marubeni, to promote SHIGETA’s clean beauty brand. Recently, the Korean beauty market also attracted heavy investment from 12 domestic companies like Beiersdorf and Lotte. Similar contributions have been made to expand clean & natural products in Japan and Singapore. Among developing countries, India focuses on alternative medicinal methods, such as Ayurveda, and blending science with nature.
Chapter 1. Introduction of Sustainability in Clean Beauty
1.1. Top Countries in the Beauty, Cosmetics, and Skincare Industry
1.2. Legislation and Policy Landscape – Clean Beauty
1.3. Investments in Clean Beauty Across the Top Countries in the World
1.4. Innovations in Clean Beauty – Organic/Sustainable Products
1.5. Patents
1.6. Mergers, Deals & Acquisitions
Chapter 2. Industry Benchmarking
2.1. Overall Industry Disclosure Score
2.2. Disclosure Score Benchmarking
2.3. SWOT Analysis
Chapter 3. Company Profiles
3.1. Kao Corporation
3.2. Unilever PLC
3.3. Shiseido Co. Ltd.
3.4. L’Oreal S.A.
3.5. The Estee Lauder Companies Inc.
3.6. Johnson and Johnson
3.7. Beiersdorf AG
3.8. LVMH Moët Hennessy Louis Vuitton S.E
3.9. Coty, Inc.
3.10. The Procter & Gamble Company
Research methodology
Grand View Research (GVR) employs a holistic and robust research methodology focused on delivering precision. Our ESG key issues are selected following a thorough materiality analysis run by our taxonomy committee. We examine leading business journals relevant to the industry sector and where applicable references are made to a range of sources including regulatory agencies, trade associations, company filings, white papers, and analyst reports during the due diligence on data aggregation. In addition, a recurring theme that remains central to all our research reports remains data triangulation which aims to dive into the market from thematic context, regulation, and industry benchmarking, including SWOT analysis.
Eligibility Criteria and Company Selection
Each public company is curated by our senior researchers following a comprehensive study of their business involvement around a specific theme. The involvement extends to subsidiaries based on at least 50% holding by the parent company. Following this, we analyze fundamental financial indicators, including revenue and market capitalization to ensure a diverse set of companies that fairly represent the sector are included. Additionally, GVR researchers ensure the disclosure level of each company across the material ESG key issues.
Scoring Methodology
Each ESG metric is assigned a specific weight based on its relevance across sectors. Below are the aggregated weights across pillars, which are derived from each metric.
| Environment | Social | Governance |
| 40% | 30% | 30% |
GVR’s proprietary ESG score is calculated using a weighted average method at:
• Key issues level
• Pillar level
• Company level and,
• Theme level
Data Mining
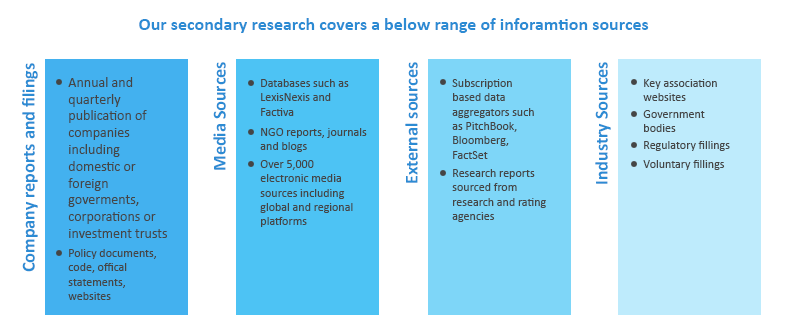
Data is obtained and collated from diverse source points. The data collected is continuously cleansed to ensure that only validated and verifiable sources are analyzed. In addition, data is also mined from a large number of in-house syndicated research reports inventory as well as through paid databases and premium content. During this research report, we conducted multiple primary interviews across the globe supported by our Primary Research Panels through the delivery of a mix of paid and unpaid interviews. We also send and receive responses from a wide section of industry participants through a carefully crafted and comprehensive survey questionnaire. We triangulate these data into quant models and generate qualitative insights. Evolving industry dynamics that shape drivers, restraints, and pricing are also gathered. As a result, the published content includes proprietary data and meaningful insights.
Fundamental ESG data:
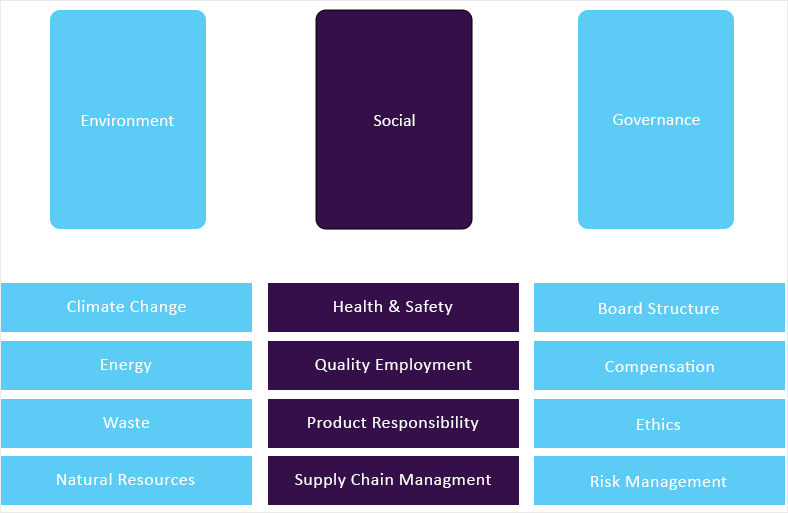
GVR’s ESG taxonomy committee maintains the framework and ensures it is updated quarterly considering market updates and relevance. Framework includes 65+ fundamental ESG metrics that are identified following a thorough materiality assessment. Below is GVR’s ESG Level-I framework:
Alternative ESG data:
GVR also analyzes macro-economic factors that impact or drive the growth of respective sectors. This includes
• Deep dive analysis of policy and regulatory landscape that has potential towards shaping the future of businesses
• Innovation quotient of a sector to gauge prospective evolution of a theme and related opportunities
• Investment scenario, including mergers & acquisition, funding and other deals to assess the investment appetite for a particular theme
• Other market activities, including market size, growth forecasts among others.
Information sources
