- Report Summary
- Table of Content
- Methodology
- Request for ESG Consultation
Report Overview
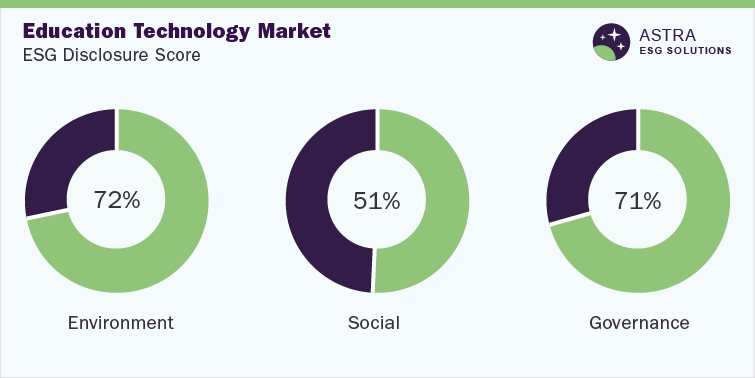
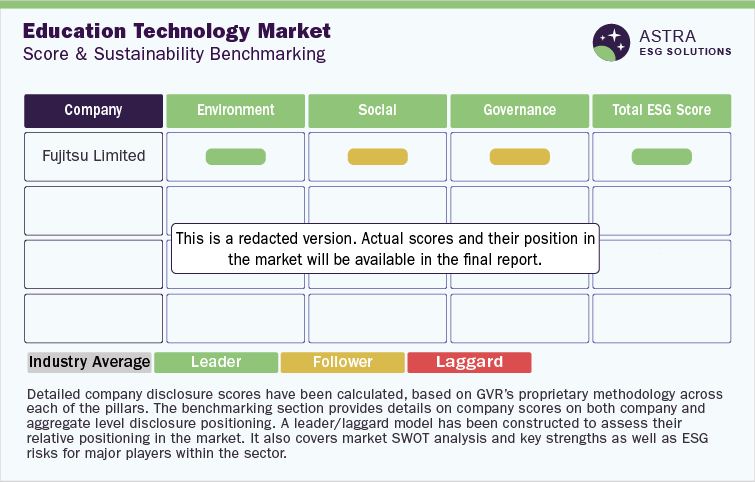
The average ESG disclosure score for the Education Technology (EdTech) market stands between 60% and 70%. This conclusion is based on the analysis of more than 60 Environmental, Social and Governance (ESG) parameters within our ESG scoring framework. Alongside Fujitsu Ltd and International Business Machines Corp. (IBM), seven other market leaders were part of our research. This research identified that only four companies, including Fujitsu Ltd and IBM, scored above the average industry score, while the six other leading companies need to improve their ESG transparency & reporting. Our research found that a majority of the ESG disclosures have been made around the governance metric, with Fujitsu Ltd being a leader in this sector when compared to other companies, such as IBM and Microsoft Corp.
Environmental Insights
E-learning can cut down emissions and lead to fuel conservation as it does not require students and educators to commute long distances. Moreover, by reducing the utilization of resources in the campus site, distance learning contributes to the conservation of natural resources & fuel. Overall, the education technology sector has a significant impact on the environmental pillar compared to social and governance indicators, according to our research.
In terms of environmental disclosure, our research found that 90% of the companies profiled had disclosures around board oversight of climate-related disclosures, disclosed energy consumption values, and were aligned with the recommendations of the Task Force on Climate-Related Financial Disclosures.
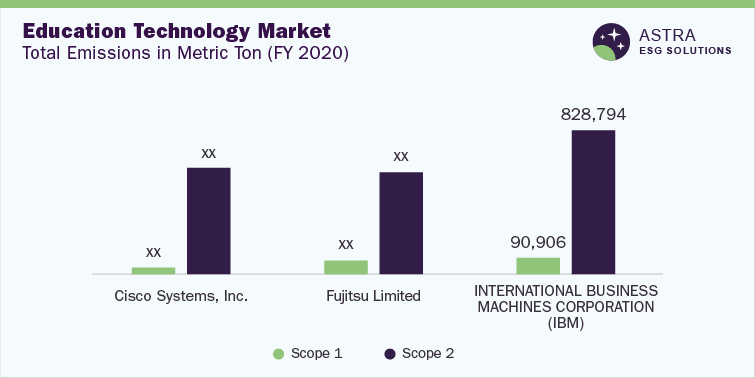
In terms of the top three companies in our research, Cisco Systems Inc. scored above 90% in environmental disclosure, followed by Fujitsu Limited and IBM. Considering the disclosure of scope 1 & 2 emissions, all nine companies profiled in our research in the EdTech sector disclosed scope 1 & 2 emissions for FY 2020.
The graph below showcases the mentioned top 3 leading companies-IBM has the highest emissions data.
In terms of energy consumption, it was observed that Cisco reported the lowest energy consumption among the top three companies in this industry. Cisco’s energy efficiency efforts are focused on implementing various techniques for reducing energy consumption, through which the company has been able to decrease overall consumption.
With respect to environmental certifications, more than 60% of the companies profiled in our research were certified to the ISO 14001 certification and all the top three companies were ISO 14001 certified. Similarly, more than 60% of the companies profiled in our research have a waste management program in place to ensure responsible production and consumption. Companies in this industry are committed to Reducing, Reusing, and Recycling (3R) waste in their operations. Through such programs, Fujitsu reduced its waste generation by around 35% in 2020 compared to the previous year.
Companies in the industry have the opportunity to improve their disclosure around the recycling of raw materials and their environmental expenditure, as only around 20% of the companies profiled in this industry have made disclosures around the above aspects.
Social Insights
EdTech companies provide a significant platform for driving education and accessibility, creating a positive social impact by reaching communities that otherwise may be disadvantaged. Education technology delivers a socioeconomic impact by promoting gender equality, closing the poverty gap, and offering quality education. Moreover, it is one of the main industries that has helped improve income and delivered positive health outcomes.
As per our assessment in the social pillar, Fujitsu leads among other companies with a social score of around 70%, followed by Samsung Electronics and Pearson Plc.
In terms of the social performance of companies profiled in our research, more than 90% of them have disclosures about employee career development, supply code of conduct, human rights policies, and employee satisfaction surveys. With respect to career development, leading companies in this industry offer leadership programs through external seminars, digital career development programs, alongside safety and compliance training. All the top three companies in the survey conduct yearly or quarterly employee engagement surveys, such as quarterly “Pulse Surveys” conducted by Pearson Plc.
However, companies profiled in this research have a large scope for improvement in terms of improving disclosure around health and safety metrics such as injury rate and having safety certifications, as less than 50% of companies profiled in our research have disclosed their total injury rate in their operations and possess ISO 45001 or ISO 18001 Health and Safety Certification. Also, despite offering career development programs, only around 30% of companies profiled in the industry disclose the average training hours they offer to their employees in a year.
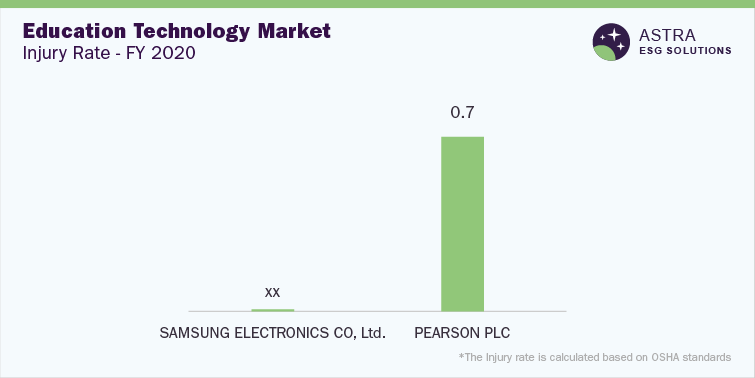
From our assessment, we found that enhanced safety culture and workplace safety management have been crucial factors in reducing the injury rate recorded by Samsung Electronics. Among the top three firms (based on safety certification), Fujitsu and Samsung are ISO 45001 health and safety management systems certified.
The graph below illustrates the total injury rate according to Occupational Safety and Health Administration (OSHA) standards for the top two companies.
Governance Insights
From a governance perspective, the Ed Tech sector can help improve transparency, increase the efficiency of administration, improve the speed with which information is disseminated, and ensure privacy and security in education. Based on governance factors across the Ed Tech industry in our research, Microsoft Corporation, Pearson Plc, and IBM led the market among the top nine companies.
Overall, more than 90% of the companies have a robust code of conduct, independent directors on board, and term limits for all the directors. Similarly, more than 90% of the companies have a Business Continuity Plan and conduct external sustainability audits. Among the top three firms, Microsoft Corporation has the highest score of above 90% for governance, followed by Pearson Plc and IBM, as per our assessment.
The percentage of independent board members has been an important governance factor because a higher percentage of independent directors improves the credibility of the company’s governance. This is evident in IBM, which had the highest number of independent directors on board compared to the top three companies in FY 2020.
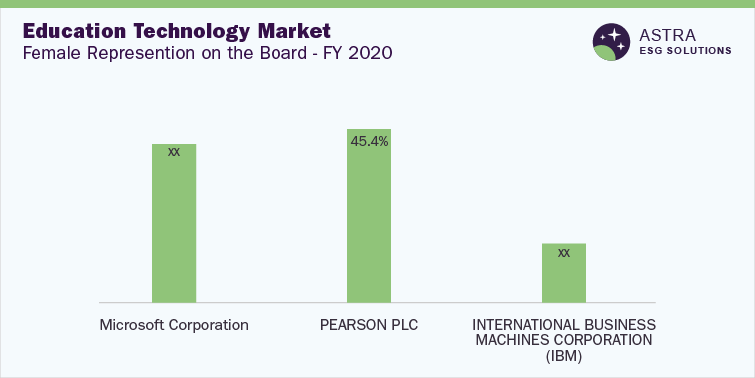
A high female representation on the board reflects that the company places a strong emphasis on diversity and has implemented the required initiatives to have an advantage over its peers. According to our research, all companies in the industry had female representation on board. However, the average representation of women was only around 30% in the industry. We found that IBM Corp. reported the highest percentage of independent board members for the year 2020, whereas Pearson Plc reported the lowest among the top three firms. The graph below shows a comparison of the female representation on the board among the top three firms.
Cyberthreats have a negative impact on companies because of various parameters such as high market cap generation, influence over society in various terms, reputation, and confidentiality. In terms of disclosures around cybersecurity, less than 55% of the firms have a cybersecurity program. Among the top three firms, Microsoft and Pearson do not specifically mention if cybersecurity issues are overseen by a board within the organization, however IBM has disclosed that it has a dedicated chief information security officer who oversees security-related risks.
Country-level Insights
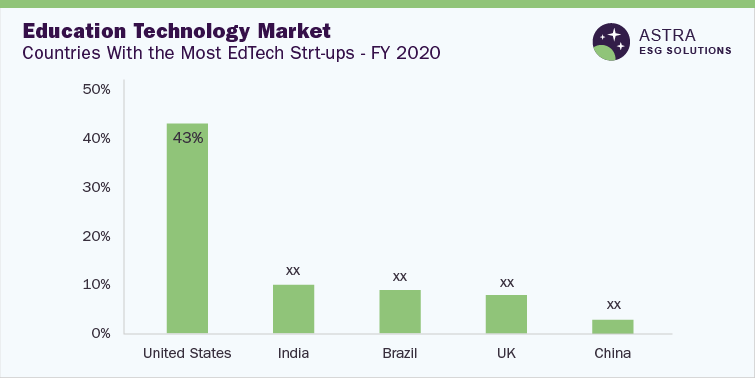
As of 2021, five countries were leaders in terms of the number of EdTech enterprises they house, as depicted in the graph. The U.S. is headquartered in 43% of the global EdTech enterprises in the world, followed by India and Brazil. However, India has the highest number of universities, followed by the U.S. and Brazil. The U.S. has been an early adopter of education technology, with 60% of global EdTech investment made in 2015.
Advancements across infrastructure, technology, and research portfolios have made the U.S. a leader in this sector. In 2020, 45% of students taking higher education courses in the U.S. were exclusively enrolled in distance-learning courses, while around 30% were involved in a part-time distance-learning course.
India has made a large contribution to the growing online education opportunities in Asia. The main factors that can drive the growth of the Indian market are the rapid expansion of internet connectivity, growth in smartphone penetration, lower comparative cost of online education programs, favorable e-learning government policies, and development of cloud infrastructure. Indians have access to quality education since schools in the country are doing well to expand access to education and are generating significant revenue to strengthen their base.
Brazil ranked third among EdTech enterprises. In fact, the Center for Brazilian Education has rolled out standard operating principles for remote learning and ensured that teaching staff are adequately educated on technological solutions for keeping up with classroom lessons. The primary fields of EdTech in Brazil are channelized through online content platforms, virtual learning environments, education management systems, educational games, and adaptive educational platforms. Quero Educação, Educross, Shapp, DreamShaper, and Witseed are among the top EdTech startups in Brazil.
As of 2020, the U.K.’s EdTech industry was the fastest-growing industry in Europe, with around 70% growth achieved in 2020. The U.K. has 8% of the world’s EdTech startups and is one of the earliest adopters of EdTech tools across schools & universities. China had 3% of the global EdTech companies, comprising around 1,000 startups and around 2,500 universities, as of 2021. Statistics reveal that in 2020 alone, the number of online education users in China was around 420 million and that EdTech startups in China have the potential to capitalize on this growth to drive the country’s digital education.
Market Overview
The EdTech market has been valued at USD 106.46 billion in 2021 and is expected to grow at a CAGR of 16.5% from 2022 to 2030. EdTech includes hardware and software technology used to educate students on a virtual platform to improve learning in classrooms & enhance education outcomes. EdTech platforms assist students in overcoming hurdles in receiving a comprehensive education by utilizing technology for learning and teaching. The technology’s ease and convenience for all kinds of people with diverse obligations make it a major phenomenon globally.
Innovation, automation, and artificial intelligence have redefined the education technology industry, leading to a digital revolution. In 2021, the sector received a Venture Capital (VC) investment of USD 20.8 billion, which is almost thrice the investment in 2019 (USD 7 million). Major global companies, including software companies, have invested in Education Technology. For instance, in December 2021, the software giant Evergreen Coast Capital acquired DreamBox learning, Blackstone invested in Renaissance Learning, and Platinum Equity acquired McGraw Hill.
While the pandemic enhanced interest in online education technologies worldwide, certain countries are leading the adoption of online education with a variety of programs and new learning innovations. One aspect that significantly influences the proliferation of EdTech across the world is high-speed internet connections. The education industry is the largest sector in the global economy, and with the rise of ESG-focused investing, the EdTech market is expected to receive a large infusion of capital from impact investors.
Chapter 1. Introduction of Sustainability in Education Technology (Ed Tech)
1.1 Global EdTech Market Perspective
1.2 Regulatory Frameworks in the Ed Tech Sector – A Challenge to the Industry
Chapter 2. Industry Benchmarking
2.1 Overall Industry Disclosure Score
2.2 Disclosure Score Benchmarking
Chapter 3. Company Profiles
3.1 Fujitsu Limited
3.2 International Business Machines Corporation (IBM)
3.3 Microsoft Corporation
3.4 Samsung Electronics Co. Ltd.
3.5 Cisco Systems Inc.
3.6 Pearson Plc
3.7 Alphabet Inc.
3.8 Adobe Inc.
3.9 Chegg Inc.
Research methodology
Grand View Research (GVR) employs a holistic and robust research methodology focused on delivering precision. Our ESG key issues are selected following a thorough materiality analysis run by our taxonomy committee. We examine leading business journals relevant to the industry sector and where applicable references are made to a range of sources including regulatory agencies, trade associations, company filings, white papers, and analyst reports during the due diligence on data aggregation. In addition, a recurring theme that remains central to all our research reports remains data triangulation which aims to dive into the market from thematic context, regulation, and industry benchmarking, including SWOT analysis.
Eligibility Criteria and Company Selection
Each public company is curated by our senior researchers following a comprehensive study of their business involvement around a specific theme. The involvement extends to subsidiaries based on at least 50% holding by the parent company. Following this, we analyze fundamental financial indicators, including revenue and market capitalization to ensure a diverse set of companies that fairly represent the sector are included. Additionally, GVR researchers ensure the disclosure level of each company across the material ESG key issues.
Scoring Methodology
Each ESG metric is assigned a specific weight based on its relevance across sectors. Below are the aggregated weights across pillars, which are derived from each metric.
| Environment | Social | Governance |
| 40% | 30% | 30% |
GVR’s proprietary ESG score is calculated using a weighted average method at:
• Key issues level
• Pillar level
• Company level and,
• Theme level
Data Mining
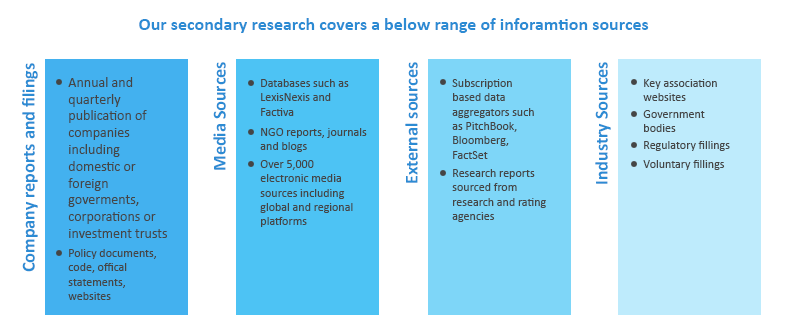
Data is obtained and collated from diverse source points. The data collected is continuously cleansed to ensure that only validated and verifiable sources are analyzed. In addition, data is also mined from a large number of in-house syndicated research reports inventory as well as through paid databases and premium content. During this research report, we conducted multiple primary interviews across the globe supported by our Primary Research Panels through the delivery of a mix of paid and unpaid interviews. We also send and receive responses from a wide section of industry participants through a carefully crafted and comprehensive survey questionnaire. We triangulate these data into quant models and generate qualitative insights. Evolving industry dynamics that shape drivers, restraints, and pricing are also gathered. As a result, the published content includes proprietary data and meaningful insights.
Fundamental ESG data:
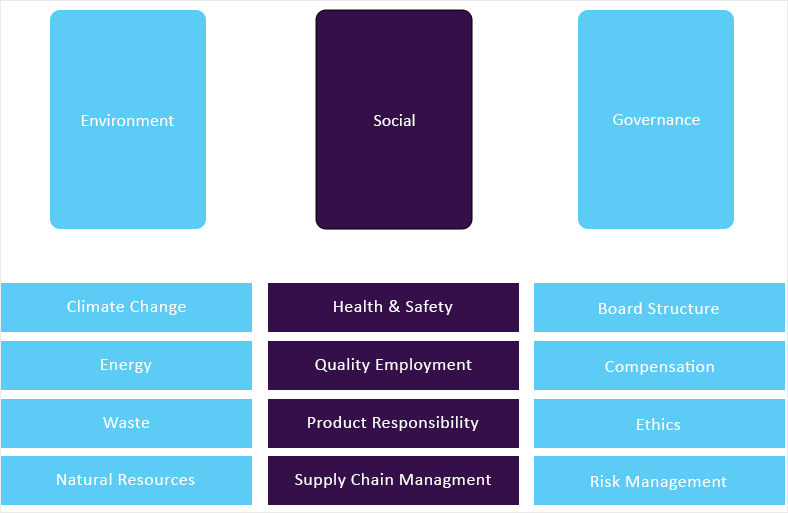
GVR’s ESG taxonomy committee maintains the framework and ensures it is updated quarterly considering market updates and relevance. Framework includes 65+ fundamental ESG metrics that are identified following a thorough materiality assessment. Below is GVR’s ESG Level-I framework:
Alternative ESG data:
GVR also analyzes macro-economic factors that impact or drive the growth of respective sectors. This includes
• Deep dive analysis of policy and regulatory landscape that has potential towards shaping the future of businesses
• Innovation quotient of a sector to gauge prospective evolution of a theme and related opportunities
• Investment scenario, including mergers & acquisition, funding and other deals to assess the investment appetite for a particular theme
• Other market activities, including market size, growth forecasts among others.
Information sources
